
The American Chemical Society (ACS) graciously provided demographics information regarding COMP members attending the Indianapolis National Meeting (INM) during September 2013; commonly referred to as the fall 2013 national meeting (NM). The goal of this analysis was to better understand the types of COMP members attending the fall 2013 NM. Compared to other fall national meetings, the INM took place during the first week of September while a majority of fall NMs occur during the second through last week of August. An additional difference to the INM compared to other fall NMs is that it was held in a city that had not hosted an ACS NM with the last decade. While each NM has individual characteristics due to the time of year it is held and its location, they share overall features that can be assigned to all the meetings or only the fall and spring meetings respectively.
Indianapolis National Meeting Attendance
A total of 10,803 individuals registered for the Indianapolis ACS meeting with 2664 being “Students”, 6849 being “Professionals”, 872 being “Exhibitors”, and 418 people registering to attend only the Exposition; see Figure 1 “National Meeting Attendee Classification”. The classification of “Student” includes undergraduate and graduate students while “Professionals” includes post docs and professors from academia and scientists working in industrial settings such as biotechnology, pharmaceutical, petroleum, materials, or startup companies. Approximately 25% of the registrants were students and another 63% were considered professionals; chemists with at least a bachelor’s degree; those classified as “Regular” ACS members. The remaining 12% of registered INM attendees were related to the exposition. There were 7,123 abstracts presented at the INM resulting in a 1.3 attendee (excluding exhibitor and exposition only registrations) to abstract ratio and is similar to recent NMs.
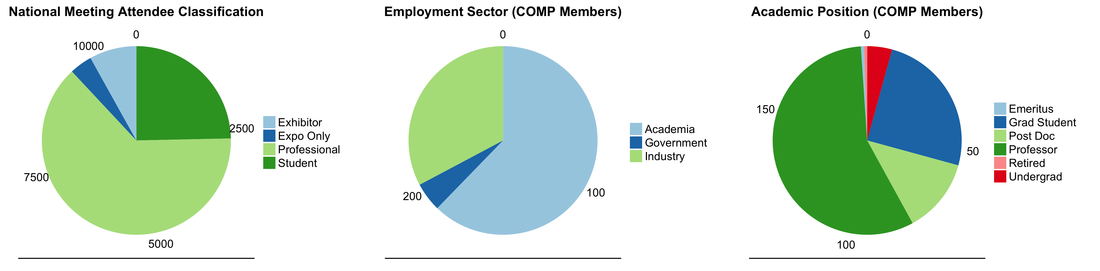
Figure 1. Fall 2013 National Meeting Attendance (Indianapolis, Indiana)
Of the 10,803 registered attendees, 302 of them were COMP members. The number of COMP members in 2013 was 2235 thus 13.5% of the COMP division attended the INM. The 302 COMP members were divided into their employment sector based on ACS membership type and self-reporting during the INM registration process. One hundred and eighty-eight (62%) members indicated they were in academia, 99 (33%) members were employed in industry, and the US government employed 15 (5%); see Figure 1 “Employment Sector (COMP Members)”. The 99 scientists employed within the “Industry” sector includes 42 chemists that indicated their industry as “Other” along with those that self-classified as being part of the “Retail/Wholesale Trade”, “Engineering/Construction Firm”, along with attendees that did not provide a response. The 57 other chemists that are classified as “Industrial” include those that work as “Manufacturers” and “Independent Consultants and Laboratories”.
COMP Member Demographics
The demographic information of the COMP members that attended the INM differs slightly from the 2013 COMP member demographics; see Table 1. The ratio of female-to-male attendees was slightly greater for females (18.1% compared to 17.5%) than that of the COMP division. The median age of the attendees was half-a-year less compared to the division, while the mean age of COMP attendees was almost a year greater for attendees. A three-and-half-year increase in the median number of years of ACS service is also seen while the median number of COMP service remains the same between attendees and the COMP division. Based on the gender and age information of the six-years-or-more (the “established”) subgroup, this portion of the COMP membership mirrors the complete COMP division with respect to age, gender, and years of ACS service while decreasing slightly for years of COMP service. Comparing attendees that reside in the US to those from other countries, it can be seen that those residing outside of the US and attending the INM are older based on median age – yet similar based on mean ± standard deviation – and have considerably fewer years of service to the ACS and COMP.
| Table 1. COMP Member Demographics for the Indianapolis National Meeting and the Complete Division | ||||||||||
|---|---|---|---|---|---|---|---|---|---|---|
| Age | ACS membership | COMP membership | Provided Gender & Age | |||||||
| number | female | male | median | mean±SD | median | mean±SD | median | mean±SD | ||
| All | 302 | 38 (18.1) | 172 (81.9) | 46.5 | 48.2±13.18 | 11.5 | 14.2±13.07 | 5 | 8.4±8.73 | 63.9% |
| 1st yr | 61 (20.2) | 1 (33.3) | 2 (66.7) | 21 | 21.7±3.06 | 1 | 1±0.00 | 1 | 1±0.0 | 4.9% |
| ≤ 5 yrs | 104 (34.4) | 5 (21.7) | 18 (78.3) | 31.5 | 31.6±7.58 | 1 | 2±1.43 | 1 | 1.7±1.16 | 19.2% |
| ≥ 6 yrs | 198 (65.6) | 33 (17.6) | 154 (82.4) | 48.5 | 50.1±12.33 | 17 | 20.6±11.83 | 10 | 12±8.90 | 87.4% |
| US | 268 (88.7) | 33 (17.0) | 161 (83) | 46 | 48.2±13.39 | 13 | 15±13.27 | 6 | 8.7±8.83 | 66.8% |
| Intl | 34 (11.3) | 5 (31.2) | 11 (68.8) | 50.5 | 48.7±10.37 | 4 | 7.7±9.14 | 2 | 6.4±7.75 | 41.2% |
| 2013 | 2235 | 285 (17.5) | 1347 (82.5) | 47 | 47.5±13.23 | 8 | 11.9±12.04 | 5 | 7.9±8.24 | 16.9% |
The histograms and density plot of Figure 2 compares the Years of ACS Service for those that attended or missed the INM. Historically, approximately 50% of the COMP membership has been an ACS member for five-years-or-less. While only 34% of COMP INM attendees are part of the five-years-or-less (the “new”) COMP-subgroup, this discrepancy could be due to a portion of the subgroup attending only the spring or fall NM. Based on the Years of ACS Service, the COMP members that attended and missed the INM along with the entire COMP division have similar trends.
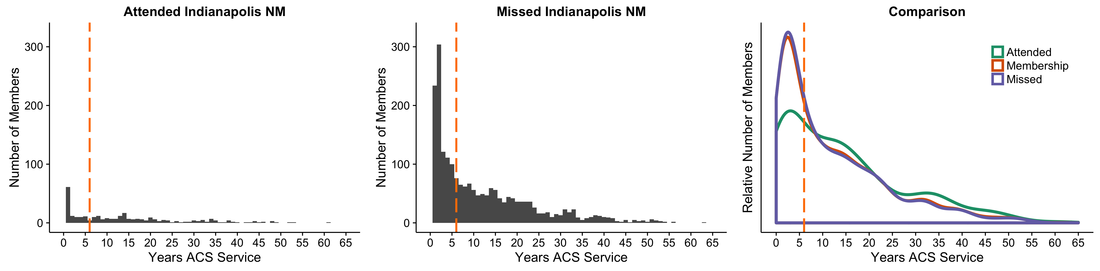
Figure 2. COMP Member Years of ACS Service. The orange dashed-line is the separation between the “new” and “established” COMP member subgroups.
The fall NMs are traditionally less-student focused due to when they are held (mid-to-late August) when the students may be working or not attending school. The INM demographics could be significantly different compared to other fall NM because it was held during early-September allowing students who performed summer research to attend the NM during the fall semester. The proportion of COMP undergraduate and graduate students – eight undergraduate and 47 graduate students – attending the INM compared to other NMs and divisions is hard to determine because access to this attendance data is not available. The number and type of ACS members that attended the INM compared to the COMP division’s members in 2013 indicates that only 6% of undergraduate members and 12% of graduate student members attended the INM; data provided in Table 2. Interestingly, the COMP division in 2013 had 201 new members use the “Free Year of COMP Membership” option provided by the ACS and almost 28% of them attended the INM; 18.5% of COMP members that attended the INM did not pay to be a COMP member in 2013.
The fall NMs are traditionally less-student focused due to when they are held (mid-to-late August) when the students may be working or not attending school. The INM demographics could be significantly different compared to other fall NM because it was held during early-September allowing students who performed summer research to attend the NM during the fall semester. The proportion of COMP undergraduate and graduate students – eight undergraduate and 47 graduate students – attending the INM compared to other NMs and divisions is hard to determine because access to this attendance data is not available. The number and type of ACS members that attended the INM compared to the COMP division’s members in 2013 indicates that only 6% of undergraduate members and 12% of graduate student members attended the INM; data provided in Table 2. Interestingly, the COMP division in 2013 had 201 new members use the “Free Year of COMP Membership” option provided by the ACS and almost 28% of them attended the INM; 18.5% of COMP members that attended the INM did not pay to be a COMP member in 2013.
| Table 2. COMP Member Classification for the Indianapolis National Meeting and the Complete Division | ||||||||
|---|---|---|---|---|---|---|---|---|
| Members | Regular | Undergrad | Grad Student | Retired | Emeritus | Affiliate | Free | |
| All | 302 | 237 | 8 | 47 | 3 | 5 | 2 | 56 |
| 1st yr | 61 | 25 | 7 | 29 | 0 | 0 | 0 | 56 |
| ≤ 5 yrs | 104 | 53 | 8 | 42 | 0 | 0 | 1 | 56 |
| ≥ 6 yrs | 198 | 184 | 0 | 5 | 3 | 5 | 1 | 0 |
| US | 268 | 208 | 8 | 43 | 3 | 5 | 1 | 45 |
| Intl | 34 | 29 | 0 | 4 | 0 | 0 | 1 | 11 |
| 2013 | 2235 | 1649 | 132 | 386 | 24 | 33 | 11 | 201 |
Member retention is a concern for the ACS and individual divisions. The information in Table 3 provides the age, gender, and retention of COMP members who attended the INM. Historically, by the second full year of COMP membership approximately 55% of COMP members have retained their COMP membership. Based on April 2015 COMP membership data, 70% of new 2013 COMP members are still COMP members. Care must be taken with interpreting this significantly larger retention percentage because the 2015 membership year has not concluded. Membership information from the end of 2015 or beginning of 2016 will provide a better view of COMP member retention. Only one undergraduate and first-year COMP member – during 2013 – attended the INM, they are currently listed as a Graduate Student COMP member in April 2015 and work as a Quality Assurance Associate at Schrödinger, Inc. The remaining four undergraduates, that were first-year COMP members at the INM, are undergraduate COMP members as of April 2015. If their class rank was sophomore during the fall of 2013 the membership type of these four individuals will likely change in the upcoming year. The 22 graduate student and 22 regular COMP members have retained their original COMP membership type as of April 2015.
| Table 3. COMP Member Age, Gender, and Retention for INM Attendees | ||||||
|---|---|---|---|---|---|---|
| Undergraduate* | Graduate Student | Regular | ||||
| All | 1st Year | All | 1st Year | All | 1st Year | |
| Median Age | 20 | -- | 27 | -- | 47 | -- |
| Mean±SD Age | 20.0±1.41 | -- | 29.0±5.27 | -- | 48.7±11.70 | -- |
| Female | 3 | 2 | 3 | -- | 32 | -- |
| Male | 5 | 3 | 10 | -- | 154 | -- |
| Retained | 6 (75.0) | 5 (71.4) | 35 (74.5) | 22 (75.9) | 211 (89.0) | 22 (88.0) |
| * Note: The number of female and male undergraduate students was determined by visual inspection. | ||||||
COMP Member Country of Residence
There were 268 (89%) COMP members that attended the INM who resided within the United States (US). The 34 COMP attendees residing outside of the US were from: Great Britain (7 members), Canada (5), China (3), France (3), Japan (3), Israel (2), the Netherlands (2), Russia (2), Australia (1), Switzerland (1), Ecuador (1), Ireland (1), Kazakhstan (1), Portugal (1), and Taiwan (1). Part of the publicity campaign for the INM was its central location for a large portion of the ACS membership.
COMP Member Geographic Distribution
The following analysis of COMP members attending the INM resided within the US. Of the 2235 COMP members in 2013, 48 lived within 100 miles of the Indianapolis Convention Center (ICC) while 96 and 353 of them lived within 150 and 350 miles, respectively, of the ICC. The “Attended INM” histogram in Figure 3 indicates the number of COMP members who attended the INM (fall 2013) meeting within a specific distance. The COMP members are binned into 50-mile increments of the ICC with the orange, purple, and green dashed vertical lines indicating 100, 150, and 350 miles, respectively, from the convention center.
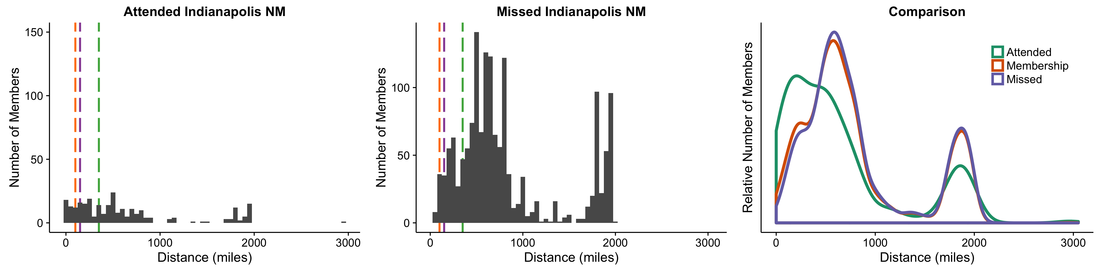
Figure 3. Distance between COMP Members and Indianapolis NM
The “Missed INM” histogram is the number of COMP members who did not attend the INM segmented into 50-mile increments from the convention center. A comparison between these two groups and the entire COMP membership is provided in the “Comparison” plot. Of the 268 COMP members who attended the meeting and resided within the US, 108 (40%) of them lived within 350 miles of the meeting site while more than half, 149 (56%) members, lived within 500 miles of Indianapolis. The information presented in the “Attended INM” and the “Comparison” plots illustrates that COMP members living close to Indianapolis attended, along with those on the East and West Coasts; see maps in Figure 5.
The “Missed INM” histogram is the number of COMP members who did not attend the INM segmented into 50-mile increments from the convention center. A comparison between these two groups and the entire COMP membership is provided in the “Comparison” plot. Of the 268 COMP members who attended the meeting and resided within the US, 108 (40%) of them lived within 350 miles of the meeting site while more than half, 149 (56%) members, lived within 500 miles of Indianapolis. The information presented in the “Attended INM” and the “Comparison” plots illustrates that COMP members living close to Indianapolis attended, along with those on the East and West Coasts; see maps in Figure 5.
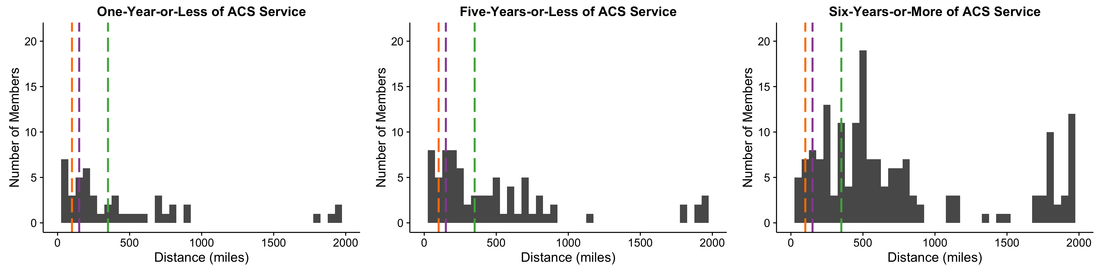
Figure 4. Distance between “New” and “Established” COMP Members and Indianapolis NM
The idea that scientists join the ACS to present and/or attend the NM when it is held in their city of residence is intriguing. First-year COMP members comprised 20% of COMP attendees at INM yet were 31% of COMP attendees who lived within 100 miles of ICC, 35% within 150 miles, and 28% within 350 miles. While the five-year-or-less COMP member subgroup, which comprised a third of the COMP members who attended the INM, accounted for 46% of COMP attendees who resided within 100 miles of the ICC, 47% within 150 miles, and 43% within 350 miles.
The four maps of Figure 5 illustrate where in the US COMP members lived who attended and missed the INM.
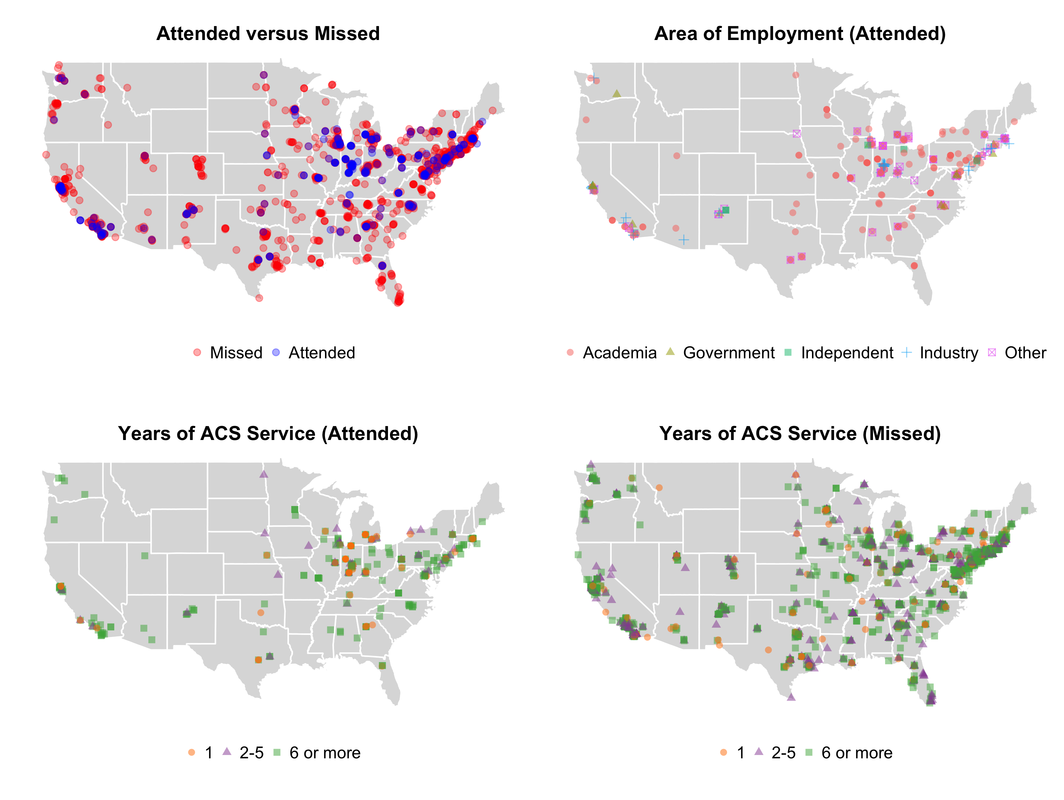
Figure 5. Residence of US COMP Members
Conclusions
Based on age, gender, and years of COMP service (duration of COMP membership) the COMP INM attendees mirrored the demographics of the COMP division yet attendees had more years of ACS service. The cause for the difference between years of ACS and COMP service is likely changes in members’ careers after joining the ACS. The COMP division can be considered very similar to technology companies such as Facebook and Google due to the use of computers, programming, and math. Unfortunately, the COMP division’s gender demographic mirrors the tech-industry with only 18% of COMP members being female. It would be interesting to know the female to male ratio within the ACS and for individual divisions.
A majority of the COMP attendees were from academia and this could be a function of location. The Midwestern US is home to numerous educational institutions including 11 of the Big Ten Conference’s 12 universities; the University of Maryland and Rugters University – New Brunswick joined the Big Ten Conference in 2014. Given the location one could have expected a large proportion of academic attendees but since the meeting was held after of the traditional start of the academic year, many professors and students were not likely to attend. Of the 751 COMP members (for 2013) who lived within 350 miles of the ICC only 108 (14%) attended the INM.
The proportion of “new” compared to “established” COMP member attendees follows a similar trend to the overall COMP division but without attendee information for the spring 2013 NM held in New Orleans, it is hard to determine how many and which first-year and “new” subgroup members attended a NM along with which NM they attended. With the current information, it is impossible to determine which attendees presented at the INM, or any NM, or whether they presented a poster or talk. The ability to match presenting author with registered attendee is possible using email addresses but this method will not match all attendees and presenters because it is likely that members will provide their institutional email address with their abstract but have their “home” email address associated with their ACS ID. Requiring everyone to submit their abstract and register for ACS meetings using their ACS ID will aid in being able to match attendee and presenter information, but this method will only be fully successful if the submitting and registering ACS IDs are the same. It is still common for administrative support to enter abstracts and register scientists.
With respect to all demographics information, it would be interesting to see how attendance for the INM compares to NM held in Boston, Philadelphia, San Diego, and San Francisco since these cities frequently host ACS NMs.
Serious concern is noted regarding the severely low percentage of members providing gender and year of birth information when becoming ACS members. This severe discrepancy between gender and age information provided by new and established COMP members is the result of the ACS no longer requiring new members to provide this information. Approximately 5% of new ACS members provide their gender and age when applying; only three (4.9%) first year COMP members attending INM provided gender and year of birth information. The recent lack of gender and age information for new ACS members hinders the ability to understand which services are likely of importance to the membership as a whole. Unfortunately, the more established COMP members overshadow the provided demographics information for the newer COMP members because the latter group does not provide this information at the same rate as the former.
 RSS Feed