
Using 14 years of COMP membership data (2002, 2004-2016), an understanding of the division’s historical demographics was established. Large reductions in membership density have occurred in numerous cities across the US with membership increases for national meeting (NM) cities for the year of or following a NM. Combining the membership data with Indianapolis NM (INM) attendance information – graciously provided by the American Chemical Society – gave the means to better understand the composition of the COMP members who attended a fall NM. Based on age, gender, and years of COMP service (duration of COMP membership) the COMP INM attendees mirrored the demographics of the COMP division yet attendees had more years of ACS service.
Membership Demographics
The 2015 demographics information is based on the November 2015 eRoster and historical values were culled from COMP’s eRosters archive.
In November 2015 there were 2048 COMP members, representing a continued decline in membership. A subtle increase in the number of members (January 2016; n=2086) is likely the result of scientists joining COMP, and thus the ACS, to attend and present at the San Diego NM. The COMP division is gender imbalanced with 18.6% women and 81.4% men (based on 1400 responses) and this composition is similar to previous years. In 2002 57.5% of the 2167 responding COMP members were <45 years of age. This percentage has shifted to 39.6% (<45) versus 60.4% (≥45) for the 1264 responses in 2015. The reduced percentage of members providing birth year and gender information is likely the result of changes to how the ACS collects demographic information. The percentage of new COMP members providing birth year and gender information decreased from 74.4% (n=360) in 2005 to a low of 16.9% (n=248) in 2013 and increased to 25.4% (n=287) for 2015. Fifty-six (90.3%) of the 62 new COMP members joining in January 2016 shared their birth year and gender indicating a change in how the ACS collects this information for new members.

The number of COMP members belonging only to the COMP division has remained relatively constant since 2005; 987 members yet the percentage of COMP-only members has steadily grown from 40.3% to 47.8% (n=979) in 2015 due to the reduction in overall members. This can indicate COMP is viewed as a “big tent” division where all chemical areas are welcomed, represented, and given a voice. Almost a third of COMP members (31.8%; n=652) belong to one other division and 11.9% (n=244) belong to two other divisions. The CINF, MEDI, and PHYS divisions are the most popular divisions for COMP members.
In 2002 a majority (60.9%; n=1531) of members had 5-years-or-less of COMP service. This ratio has slowly shifted towards parity with 51.9% (n=1063) having 5-years-or-less of COMP service in 2015.
The three largest foreign residencies for COMP members in 2015 were: Great Britain (3.2%; n=65), Canada (2.4%; n=49), and Japan (2.2%; n=45).
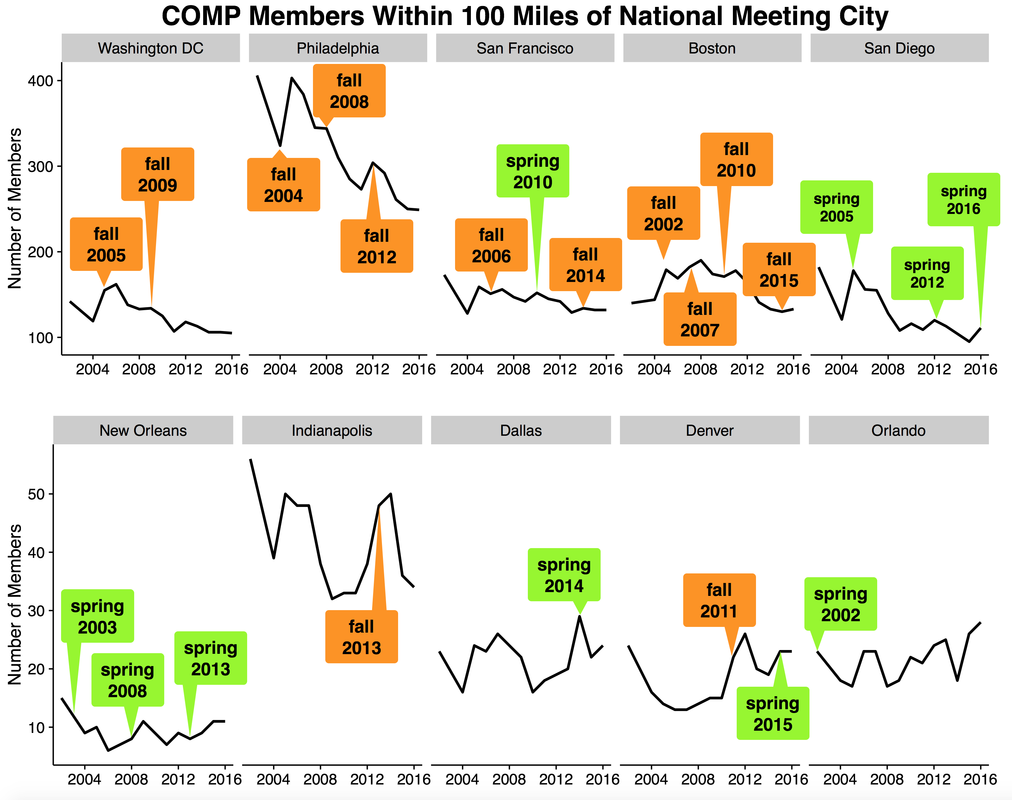
Members Near National Meetings
It is common to see the number of COMP members increase near cities during years they host a NM; in some cases the increase in members is not realized until the following year. Spikes in COMP membership are observed for the noted subset of recent NM cities. Interestingly, cities with traditionally large numbers of COMP members have experienced a decline in COMP members over the past decade with exceptions for NM years. This is most evident in Philadelphia (including nearby Princeton, ~38 miles, and NYC, ~82 miles), Boston, and San Diego. Indianapolis is an extreme case of COMP membership increasing with approximately 20 new members corresponding to the INM.
In 2002 a majority (60.9%; n=1531) of members had 5-years-or-less of COMP service. This ratio has slowly shifted towards parity with 51.9% (n=1063) having 5-years-or-less of COMP service in 2015.
The three largest foreign residencies for COMP members in 2015 were: Great Britain (3.2%; n=65), Canada (2.4%; n=49), and Japan (2.2%; n=45).
Members Near National Meetings
It is common to see the number of COMP members increase near cities during years they host a NM; in some cases the increase in members is not realized until the following year. Spikes in COMP membership are observed for the noted subset of recent NM cities. Interestingly, cities with traditionally large numbers of COMP members have experienced a decline in COMP members over the past decade with exceptions for NM years. This is most evident in Philadelphia (including nearby Princeton, ~38 miles, and NYC, ~82 miles), Boston, and San Diego. Indianapolis is an extreme case of COMP membership increasing with approximately 20 new members corresponding to the INM.
The Indianapolis National Meeting
The INM attracted 10,803 registrants (9513 attendees and 1290 exhibitors & expo-only), 7123 presented abstracts with a 1.3 attendee to abstract ratio. There were 2235 COMP members in 2013 and 13.5% (n=302) attended the INM. The attending COMP members were primarily from academia (62.3%; n=188) with 32.8% (n=99) from industry, and 4.9% (n=15) employed by government laboratories.
The INM attracted 10,803 registrants (9513 attendees and 1290 exhibitors & expo-only), 7123 presented abstracts with a 1.3 attendee to abstract ratio. There were 2235 COMP members in 2013 and 13.5% (n=302) attended the INM. The attending COMP members were primarily from academia (62.3%; n=188) with 32.8% (n=99) from industry, and 4.9% (n=15) employed by government laboratories.
| members | women | men | age | ACS service | COMP service | # regular | # UG | # grad student | # other | # free | |
|---|---|---|---|---|---|---|---|---|---|---|---|
| All | 302 (100%) | 38 (18%) | 172 (82%) | 46.5 | 11.5 | 5 | 237 | 8 | 47 | 10 | 56 |
| 1st year | 61 (20%) | 1 (33%) | 2 (67%) | 21 | 1 | 1 | 25 | 7 | 29 | 0 | 56 |
| ≤ 5 yrs | 104 (34%) | 5 (22%) | 18 (78%) | 31.5 | 1 | 1 | 53 | 8 | 42 | 1 | 56 |
| ≥ 6 yrs | 198 (66%) | 33 (18%) | 154 (82%) | 48.5 | 17 | 10 | 184 | 0 | 5 | 9 | 0 |
| US | 268 (89%) | 33 (17%) | 161 (83%) | 46 | 13 | 6 | 208 | 8 | 43 | 9 | 45 |
| Intl | 34 (11%) | 5 (31%) | 11 (69%) | 50.5 | 4 | 2 | 29 | 0 | 4 | 1 | 11 |
| 2013 | 2235 (100%) | 285 (18%) | 1347 (82%) | 47 | 8 | 5 | 1649 | 132 | 386 | 11 | 201 |
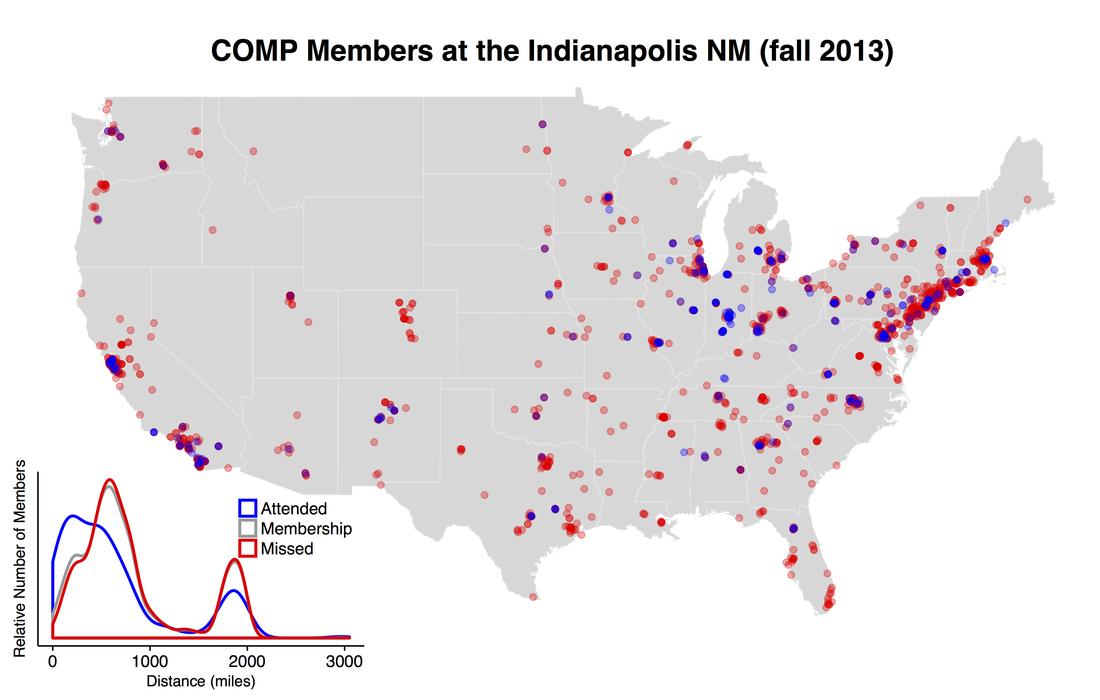
A majority (55.6%, n=149) of COMP attendees resided within 500 miles of Indianapolis compared to 34.2% (n=628) of 2013 COMP members. Interestingly, the proportion of members from the west coast, ~1500 to 2000 miles from Indianapolis, mirrored COMP’s membership distribution for the west coast. COMP members in their first-year of ACS membership accounted for 18.3% (n=49) of COMP attendees yet were 31.4% (n=11), 34.7% (n=17), and 22.8% (n=34) of attendees residing within 100, 150, and 500 miles, respectively, of the INM. These values are for COMP members residing within the United States.
Closing Thoughts
Retrospective analysis of national meetings provides divisions a way to understand how their membership behaves with respect to NM along with understanding where they reside to organize divisional activities outside of NM and at regional meetings. Because divisions do not have access to national and regional meeting attendee information, the divisions would benefit from the ACS providing the raw information to the divisions along with end-of-year membership datasets.
Acknowledgments
This analysis could not have been performed without the help of Mikal C Ankrah and Michele Hassanyeh of the American Chemical Society and Ed Sherer and Hanneke Jansen the past secretaries of the COMP division.
 RSS Feed